Home
Introduction
Pounds Recovered
By Destination
% of Total Recovered
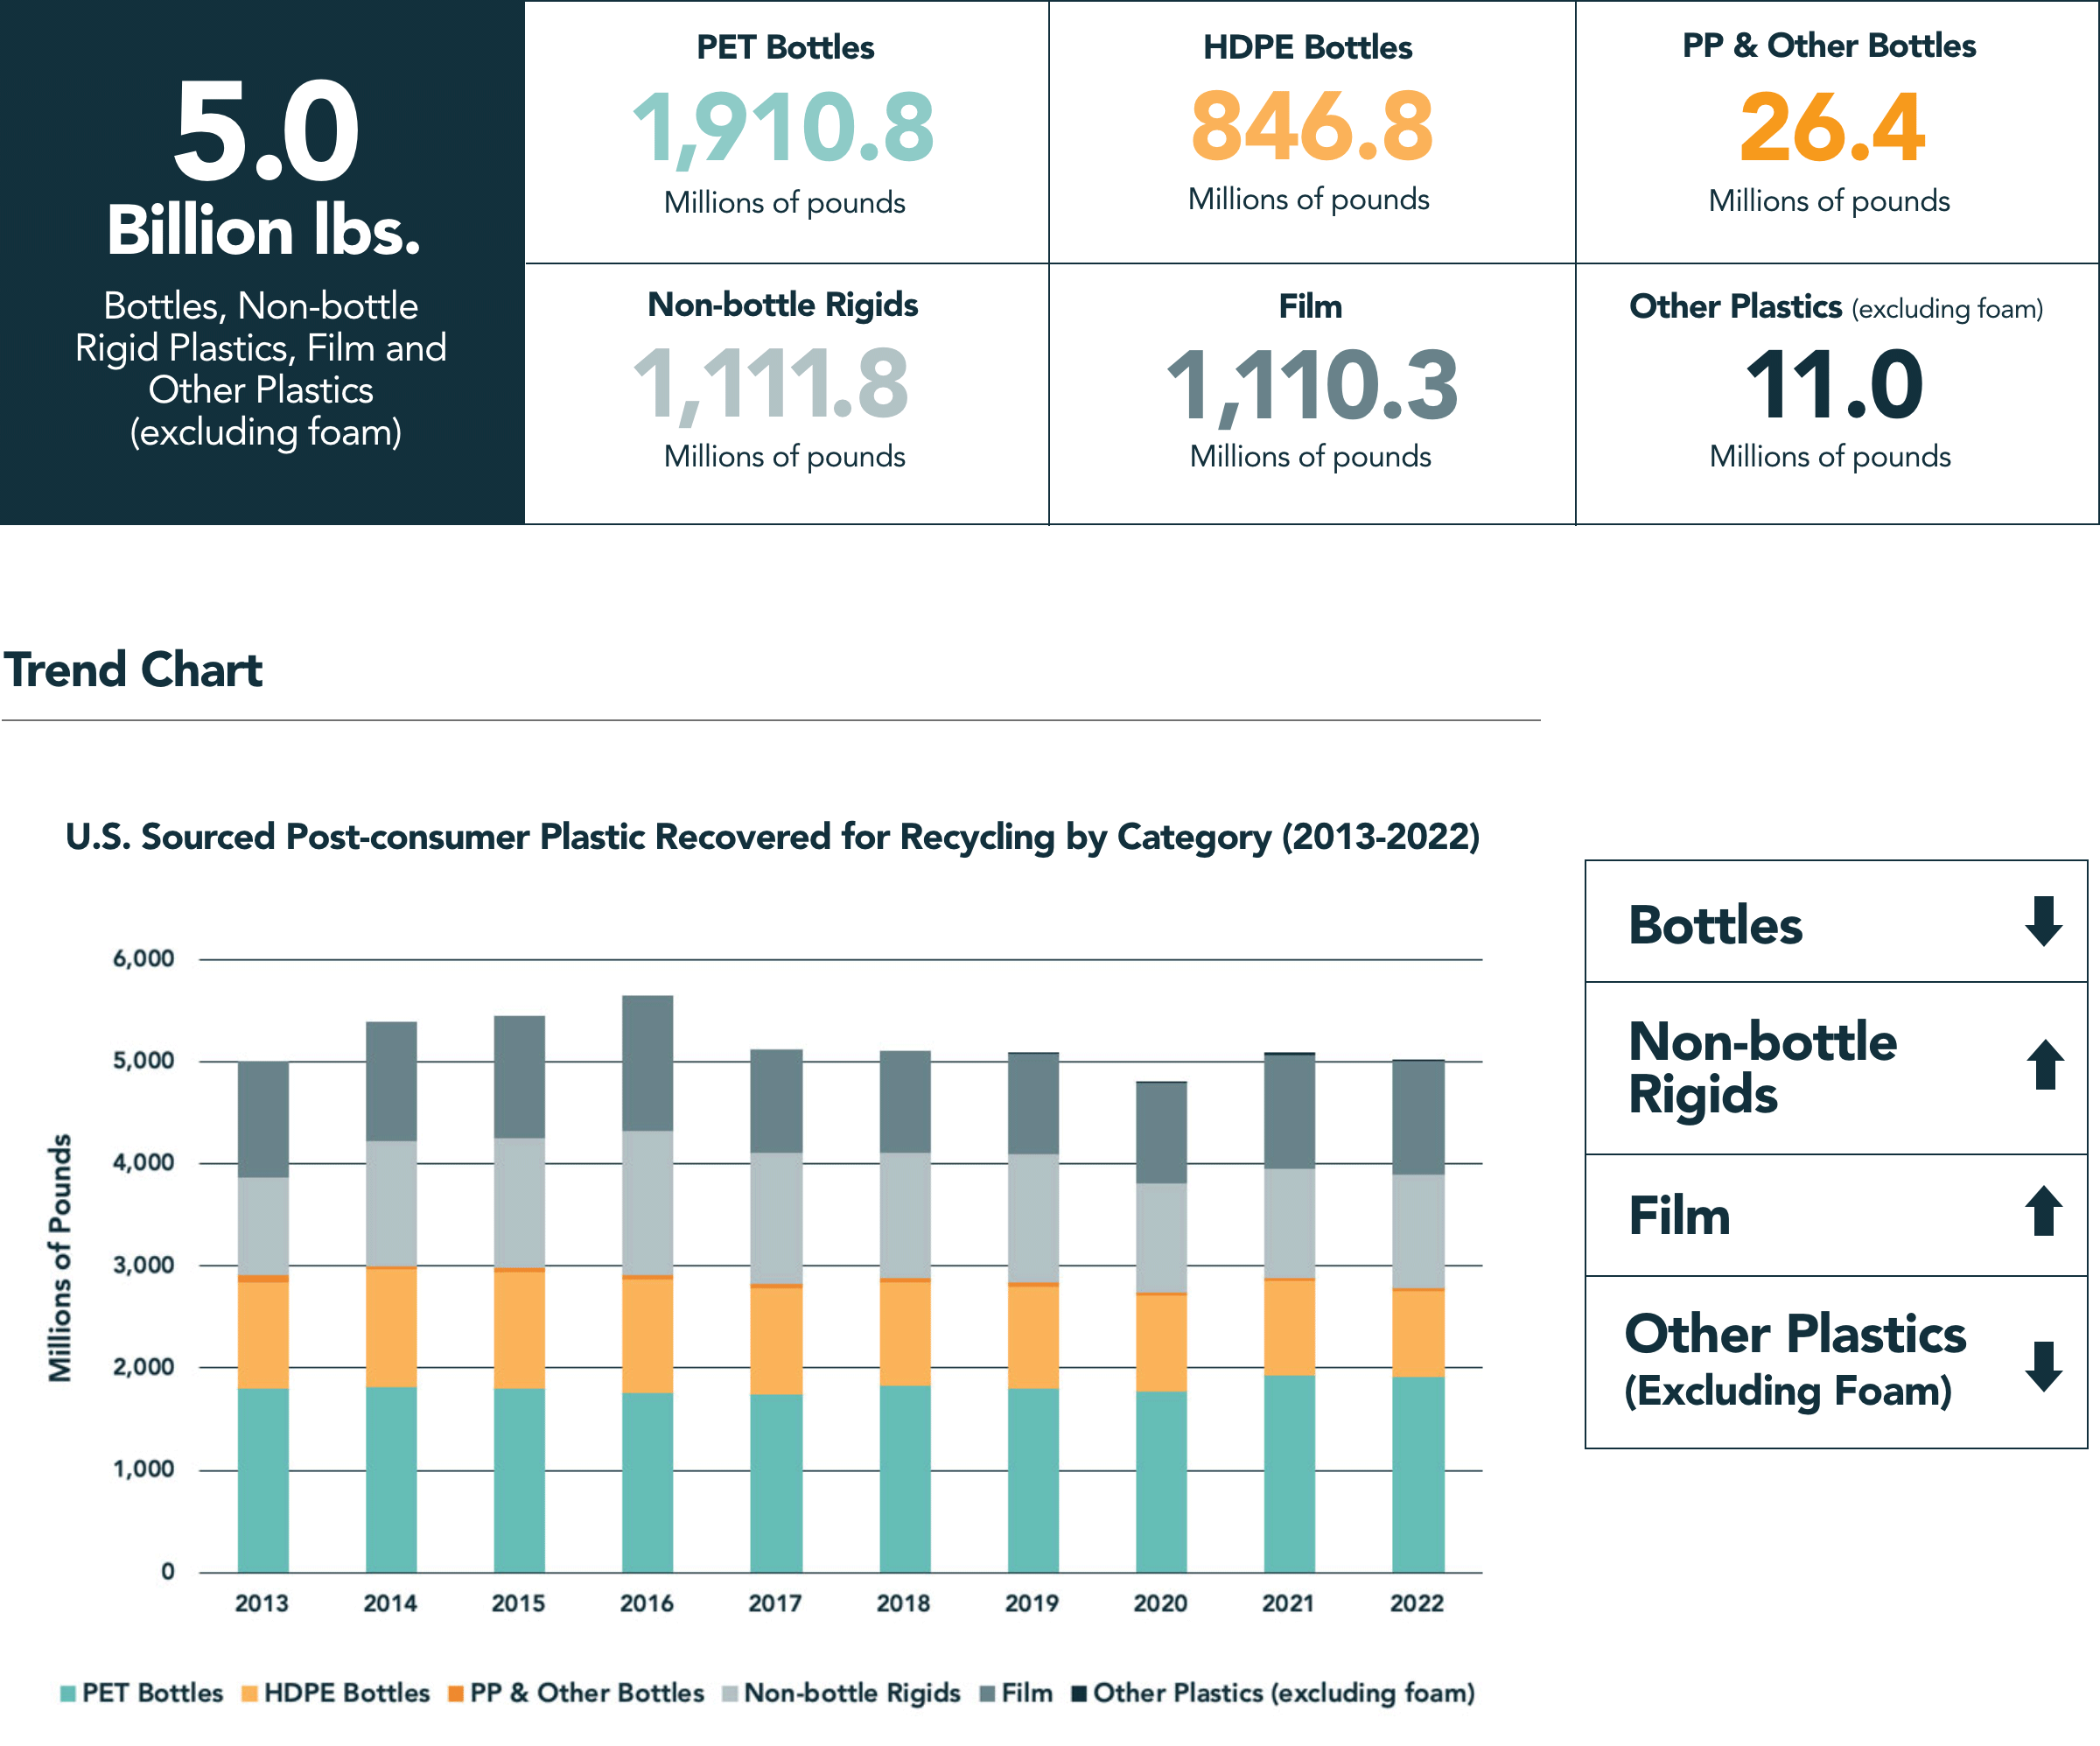
U.S. Sourced Post-consumer Plastic Pounds Recovered for Recycling in 2022

Total Recovered for Recycling in 2022 includes all destinations, including North America as well as Export Overseas.
In 2022, a minimum of 5,017.2 million pounds of post-consumer plastic material sourced in the U.S. was recovered for recycling in the categories of Bottles, Non-bottle Rigids, Film, and Other Plastics (excluding foam). Post-consumer plastic recovered for recycling was down overall by 71.2 million pounds, compared to an increase of 284.6 million pounds10 from 2020 to 2021.11
10. Throughout the total post-consumer plastic findings in the Bottle and PET Bottle sections, many of the totals comparing to 2021 are updated from the 2021 report due to a correction made to the PET bottle 2021 data by NAPCOR. 11. Throughout this report all reported increases or decreases are compared to 2021 unless otherwise stated. 12. The Other Plastics (excluding foam) category which includes wovens, non-wovens and other flexible products and packaging that are not included in any of the other major categories will be further delineated and reported as participation in the survey increases in future studies.
Next Source: Stina Inc.
Disclaimer
Brought to you by

Powered and managed by

 © 2024 Stina Inc. All Rights Reserved
Terms & Conditions
Privacy Policy
